Summary
- Shaping Culture Through In-Cab Technologies
- Beyond The Tech: Data is King
- Additional Tools for your Toolkit
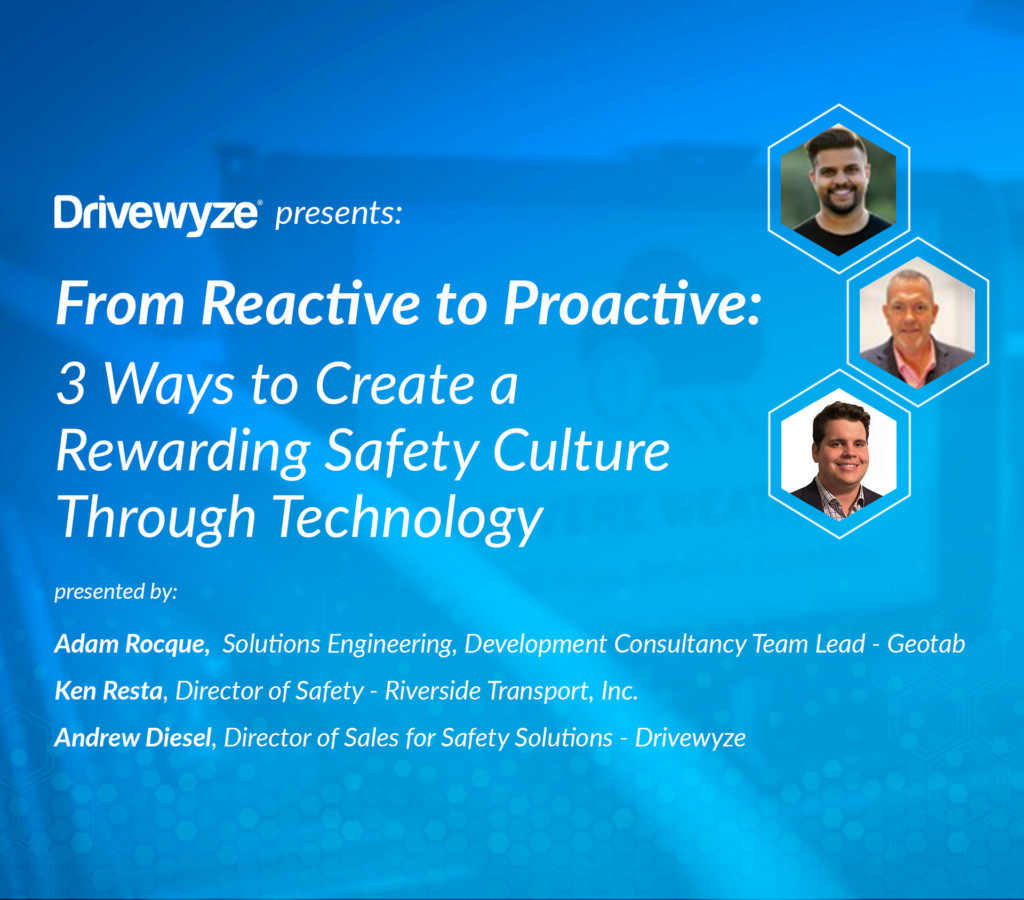
Good afternoon everyone, and welcome to today’s webinar titled From Reactive to Proactive,
three Ways to Create a Rewarding Safety Culture through Technology. I am TCA’s Director of
Education, Shayna Gibson, and on behalf of TCA’s entire leadership team, I would like to
thank you for joining us today. I would also like to express our sincere appreciation to
Drivewise and Geotab for their generosity in sponsoring today’s webinar. A few reminders
before we get started attending TCA’s educational events, such as this webinar provides
you with an opportunity to earn a certificate in human resources recruitment and
retention. And we also have a certificate for fleet management. Please visit truckload dot
org’s education page to make sure you are maximizing your opportunity to earn the credit
and recognition for attending these events. Should you become disconnected from today’s
event, you may rejoin by clicking the link provided in your registration and reminder
emails. Also, a disclaimer has been posted in the chat window for today’s session. Today’s
session is being recorded. All webinar registrants will receive an email within 48 hours
of the live webinar, which will include instructions and a link to access. The recording
questions can be submitted using the q and a or chat icon found at the bottom of your
screen, and we will acknowledge your question once it has been submitted. We would love to
see where everyone is listening in from today. Please let us know that by typing it into
the chat. It is now my pleasure to hand the conversation Note for two. Andrew Diesel,
director of Sales for Safety Solutions with Drivewise. Andrew, why don’t you get us
started today? Awesome. Thank you Shana, and, uh, appreciate the TCA having us to, um,
talk about something that’s, you know, very important, you know, in this day and age in
trucking and really the, the digital transformation that this industry is starting to see.
Um, as alluded to, my name’s Andrew Diesel. I’m the director of, um, sales for our safety
solutions here at Drivewise, and my background is in, uh, both trucking, safety and
insurance. Um, I’m gonna do a quick round of introductions. Adam, would you like to start
us? Yeah. Hi folks. My name’s Adam. Uh, I’m here from Geotab as our development
Consultancy team. Consultancy team. Um, and I work directly on figuring out integrations
and working with our API and our data to figure out how can you get that data in your
hands and play with it to really figure out cooler insights and cooler stuff you can do
and understanding the safety implications of the way your, your fleet’s operating. Thank
you, Adam. Ken. Hi, good morning. TCA. My name is Ken Rest. I’m director Riverside, Kansas
City, Kansas. I’ve been in the trucking industry for about 27 years, uh, 20 of those in
safety, as you know, in the trucking industry. And look forward to speaking to you today.
Awesome. I appreciate it. So, our webinar today, we’re gonna talk about, you know,
reactive to proactive and, and really kind of the groundwork, um, that’s been set by, you
know, Riverside Transportation along with other fleets. And you know, how technology
really plays a big part in that. And, you know, I mentioned digital transformation. You
know, we all know that it’s so hard to be proactive, you know, whenever we are coaching
drivers, you know, trying to create that safety culture. So we want to talk about some
ways and some cool innovative tools out there to really help kind of flip the script. So
kind of an agenda today, uh, you know, loose agenda at that. But we’re gonna talk about a
couple different ways that Riverside has been able to improve their safety culture through
technology. So, you know, they’ve been able to shape it obviously through Inca technology
and, you know, wanna set the stage to say that, you know, Drivewise and Geotab are on here
representing some of the tools that we have, but we all know there’s a ton of tools out
there in the truck. And, you know, we wanna make sure that everyone understands kind of
how they can work cohesively. You know, that it’s, there’s no one size fits all. You know,
there, there’s camera technology, telematics technology, there’s, there’s a lot of things
out there. So, you know, how do you, you know, in a safety role, take all of that
technology, kind of put it together to help be a more efficient, but b really, really help
drive down those, those CSA scores, your ISS score, all those things that, that matter.
And, uh, Ken’s gonna, gonna really illustrate how they’ve done that there at Riverside.
Um, we’re gonna then talk a little bit about, you know, beyond the tech and, and the role
that data really provide, uh, the role that it provides in this. And, you know, we all
know that there’s a ton of data out there and, you know, you really have to sift through
it and, and decide as a company what’s important. You know, what, what data is pertinent,
and absolutely making sure that if you have the data, you use it. So, you know, Adam’s
gonna talk a little bit about data and, and kind of the, the mindset, um, about data. And
then we’re gonna talk a little bit about, you know, some additional tools for your toolkit
and, you know, maybe, you know, open up some ideas of, Hey, how can you use some of these
tools in your current program, maybe enhance it, make it more efficient, and again, how it
can kind of live in the same ecosystem as what you have now. So with that being said, um,
I’m gonna toss it over to Ken to talk a little bit about Riverside and, and kind of what
they’ve, what they’ve been up to. Okay. Again, welcome everybody. Um, so Riverside
Transportation, as I mentioned, we are located in Kansas City, Kansas. We’re an over the
road truck haul carrier. We haul several different types of general freight and we run the
lower 48 states. Um, there’s several operations, several dedicated customers that we
service on site. Uh, we’ve been with Geotab since 2021 and we have been with Dry since
- Um, that was very complimentary for us, and we could go to the next slide there if
you want, Andrew. Um, you know, we were in a very reactive mode when I had come on board
with Riverside Transportation back in November of 21. Um, we were, we were, we were doing
a lot of things that were reactive and as, as drivers were having safety events, we were
routing them in or having conversations. And, and so coming in, there’s this huge set of
data, right? And we all know what, what safety data can look like when you start to dig
- And so our first approach was how do we uncomplicate our data? How do we look for and
identify the things that are causing us the most grief? And what can we do to, to approach
those things, right? And so when we talk about going from reactive to proactive, there’s
a, there’s a road map for that. It doesn’t happen overnight. And, and so immediately we
had to pick out based on our CSA scores at the time, what are the things that we can make
the biggest impact on in the shortest amount of time with sustainability, right? And so we
looked at speed initially, and that was where we had, you know, looked for Geotab
initially and started digging through the data, coming up with metrics on where are the
areas of the country that we’re experiencing, uh, more enforcement around speed. Are there
things that we can do around geofencing and certain parts of the country to help us
communicate better to drivers, right? There was still that approach of reactive and
punitive of drivers that were having severe speeding violations or recurring speeding
violations. And so where Drivewise came in, and I’ll talk a little bit more about Safety
Plus here in a few moments, but where driveways came in was that ability to instantly
alert the driver on the device little popup window that said, you know, high enforcement
zone or your speeding in excess of the posted speed limit. As those two things began to
complement each other, the speed data coming in from the GPS as well as the instant
feedback to the driver in the cab, we’ve seen, and, and I’ll share in future slides, we’ll
see where our compliance to speed zones has improved greatly to the point where we are now
in, in what I call satisfactory compliance with our CSA score around. And you can move on
to the next one, Andrew. So, you know, when, when we start looking at how do we leverage
our ELD to give us the data that already exists, right? As I mentioned, geofencing, um,
looking at different data sets that the driver experienced throughout day, including hours
of service, right? Being able to experience that from a, a safety management perspective
in real time. And how can I communicate to the driver without making a phone call while
they’re potentially driving down the road, right? So some is that instant feedback, and
then some of that is after the fact where we’re going and we’re looking for coaching,
training and opportunities to improve behavior. Um, and that’s really in a nutshell, you
know, what caused us to go with the safety plus part of dry wise because of that high
crash car door alerts because of those rollover alerts and, uh, weather alerts was truly
helpful in the winter. And we had a section of roadway where every winter we were
experiencing more frequency, uh, weather related crashes, and we implemented some
geofencing that were instant feedback through the Safety Plus and through the weather
alerts. And we’ve seen a reduction this past, this winter, um, in that portion of roadway
where it had been harmful to us in the past. And so there are other ways of, you know,
I’ll talk a little bit in the future about how we use really the custom messaging through
the app, um, when we get to specific locations, because I think there’s a lot of value in
that when you want it to be a popup message to, okay, so, you know, I can sit and talk to
you all day about how I feel about Drivewise Safety Plus and the impact and the
integration with the, with Geotab, but what do our drivers think of it, right? We’re
always mindful today, especially in, in this world where drivers have an easy opportunity
to switch carriers that will, what are we doing that makes our drivers happy? How do our
drivers respond to the Drivewise app giving them instant feedback in the truck? And so
here’s one, you know, one driver, and there are many examples, just like Brandon here, who
says, I, I said, Brandon, be honest with me. Tell me what you think of the dry. And he
said, man, I love my dry. And, you know, he goes on further. This gives me enough time at
the scale houses to prepare whether I should pull in, uh, similar to the way you would
react to a transponder, but there’s more opportunity to stop at places, um, where a popup
scale or a rest area that is not usually open, and I might miss that sign. This gives me
the, the opportunity to see that alert. And then he, he goes on a little further to talk
about peace of mind when it comes to, um, the high risk corridors or the high rollover
alerts or some of those other areas where their speed changes construction had hadn’t been
there on the previous run. Uh, these are things that the drivers really appreciate more
than just the bypass service. And, and again, we’ve seen huge compliance and, uh, you
know, driver acceptance is very high, which is, you know, really exciting to see. Um, so
you can go ahead, Andrew. Awesome. Andrew will touch base with, you know, on what are some
of those work. Appreciate that, Ken. And, you know, I hope everyone kind of saw from can
and heard and, you know, read on the slides a sentiment of, of communication, right? And,
you know, our Safety Plus product was, was made, um, you know, with a couple things in
mind. Number one, you know, we know that there’s alert fatigue out there, right? You think
about all the different technology in your trucks all the times, it’s chirping at a
driver, you know, the beep beep, beep, slow down, or you’re doing this, you’re doing that,
you know, our product, we, we wanted to make sure that we were addressing that issue. And,
you know, we talk about the proactiveness of it. Um, you know, Ken alluded to, you know,
it, it’s only alerting drivers whenever you are approaching, um, some of these risky
areas. So, you know, I think that’s, that, that’s one important thing to, to really call
out is, is proactiveness and, and it’s a communication piece as well. So you know that the
driver had a sentiment, it gives them peace of mind that there’s something being
communicated. You know, so many times in trucking, there’s just that, that loss of
communication, you know, between safety operations dispatched and driver, right? So, you
know, it, it really helps kind of bridge that gap in, you know, in using geofence
technology. Those messages are specific to that driver. You know, a driver in Florida
doesn’t really care, you know, what kind of bad weather is happening in, you know, in
California, right? So, you know, using that technology, we’re able to give those drivers
only alerts that are specific to them, again, to kind of reduce that alert fatigue. And,
and it’s really to create awareness. So, you know, you see on the screen there, on the
right hand side, you know, we have the, the library of alerts, which we’ll show you here
in a second, um, that are in the Safety Plus solution. Uh, the ability to set custom
alerts, and, and we’re gonna talk about that, that that’s a pretty cool feature. And, and
weather, there again, the, these are gonna be specific to those drivers. They’re gonna be
proactive, and it, it really sets the stage for a great way to track if the driver changes
their behavior or not. They get the alert a mile or two ahead, you know, what they do with
that is ultimately on them. But you’re able to see on the backend, you see on the left,
the driver coaching hub, a screenshot there. You’re able to see, you know, in, in the
portal on the backend, the data and the behavior that happened based out of that. So we
like to, you know, the fleets that we work with, we like to, to kind of say it’s, hey,
it’s, it’s your first line of defense. You’re alerting a driver of a risk zone. They
change their behavior, great. We won’t see any of the other systems capturing anything.
Most likely if they don’t change their behavior, let’s say they, they continue speeding,
or they take a corner, two too sharply, what have you, most likely some sort of telematics
technology’s gonna be going off. Maybe a, a camera system’s gonna capture an event, uh,
things of that nature. So you can really create a timeline. And you know, that that’s
another really key pillar to this is, hey, we can, you know, create a timeline whenever
we’re, we’re counseling drivers. You know, I know, you know, back in my trucking
experience when we had cameras, the number one thing a driver would say is, well, you
didn’t see what happened the previous 30 seconds before the camera, you know, turned on
well with, you know, proactive, um, alerting like safety plus you, the driver did, you
know, possibly get that alert to say, Hey, slow down. You’re coming up to a, to a high
rollover zone. You know, they didn’t change their behavior, they kept speeding. Then all
of a sudden they, they have a, a, an alert from their camera system, you know, that they,
you know, too hard of cornering, you know, hopefully they didn’t, but maybe they, they
rolled a truck, things like that. So it really helps create that timeline and, and gives,
you know, the back office a sense of, okay, here’s what was actually happening here was
maybe more the mindset of the driver. Was there behavior change or not? Um, here are, are
a couple more of our alerts within the, you know, the Safety Plus library. Um, and you’ll
see the bottom right there, the custom alerts. Um, this is the ability for you to, to
build out your own geofences. These other ones kind of come, um, you know, there’s a
library of ’em, um, that are come with the product, but, you know, bottom right there, the
custom alerts, you know, what would you say to your drivers? And, you know, Ken’s gonna
share some of the stuff they do, but we see everything from, you know, a welcome home
message around the terminals, you know, to maybe their, you know, you look at your claims
history and you pick those top five locations, or maybe you look at your speeding
citations and you know that you’re, you’re always getting a speeding citation in this one
area of the country. You know, you, you alert those drivers, Hey, you’re coming up to
this, this zone where we’ve gotten popped a few times. Um, certain customers maybe, you
know, there’s, there’s some, some areas where you have to do specific things. Think of
frost laws in the springtime up north, um, when there’s, they’re very specific and, you
know, you, you look them up on the, on the state website, uh, don’t wanna steal too much
against thunder, but those are just some, uh, some good ways to, to kind of use these. Um,
this slide here, uh, Ken’s gonna talk a little bit about their specific use cases, and I
think they got some, some very, um, very good stuff in here that I think you as an
operation could use it, you know, and, and it’d be a cross-functional thing, not only for
safety, but you know, for dispatch teams and operations. Go ahead, Ken. Yeah, thanks. So,
uh, just talk a little bit about the custom messaging through geofence technology. Uh,
yard delivery instructions is, is one, and I’ll give you an example of a customer that we
have out in Indiana, uh, and that customer, um, we haul a special product inside of a 53
foot trailer that requires a special type of securement. And so when our drivers pull onto
the drop lot, the, the Drivewise alerts, uh, the customer alert says, please call RTI
safety for special briefing. Um, and it’s a little shorter than that, but the gist of it’s
call safety for your briefing, um, when they go onto that property, traditional methods
were you would supply the driver with those instructions during the dispatch, and then
they would get there and forget, right? That they had to call for a briefing. And by the
time we found it through, you know, the other side of the GPS system, they were already a
hundred miles down the road here. We, we can also give it to them with their delivery
instructions or the pickup instructions, but as soon as they cross that threshold, it’s
that alert right on the screen that says, please call for a breeze. Um, you know, there’s
another example where we had a construction zone just outside of our terminal going across
a bridge here. Um, traditionally that was a 45 mile an hour speed zone, it was dropped
down to 25. And through some backend analytics, we turned on with, with the driveway
speeding data, we were able to just monitor if drivers were speeding through that
construction zone or not. Once we got the data, after a week or two, we turned those
alerts on and continued to run analytics for the next 30 days. And we saw that by having
the instant feedback in the truck compared to the previous period, without the instant
alerts, our driver compliance with that speed limit, um, it, it improved dramatically,
right? Um, there’s other examples where, you know, we have a customer where we run with a
curtain every other time we deliver there. Um, so we put a custom geofence that said, do
not turn here, go to the next entrance whenever they roll up on that intersection. And
we’ve almost eliminated all of our, uh, curbings at that. So those are just a few examples
of how we’ve been able to leverage the custom alerts with our geofencing, uh, through the
use of the Drivewise and the Geotab, you know, together. Awesome. Thank you, Ken. And, you
know, as I mentioned earlier, I always encourage you, you know, it sounds, sounds like Ken
did it, you know, look at your, look at your violations that you’re getting, you know,
roadside wise, look at your, your speeding tickets that, that you’re paying out on. Look
at your claims history, look at your accidents. Find those trends. I think everyone on
this call probably has a tool where they’re tracking, they’re tracking everything going
on, right? They’re tracking all their trends. So, you know, utilize that, uh, to your
advantage when you’re looking at geofencing stuff. Okay. So, you know, we talked about the
tech a little bit. I, I think we got a good overview. I wanna get into data here and, you
know, really, you know, bring Geotab into the fold here to, to talk about some data. Um,
real quick before we, before we jump there though, um, we are gonna talk a little bit, you
know, Ken mentioned, um, doing some backend looking at at analytics and stuff like that.
And what you’re seeing on the screen here is, is just a high level, uh, fleet overview,
um, o of Riverside, um, some of their data, um, through the Drivewise hub. And, you know,
the, the really the top metric that we, that we like to focus on is speed, right? Because
we all know, you know, with severity of crashes and things like that, speed is, and, and
really cause of crashes, speed is always a contributing factor. Um, you know, Kim, before
we move over to Adam, could you talk a little bit about how you utilize, um, some of that
data within Riverside, uh, when you’re looking through the, through the Drivewise hub?
Yeah. So this would be a view of really our view of our backend analytics, right? Uh, so
this is telling us after the fact what was our speed performance based on speed alerts in
that area. So an example of the driver goes from a 55 zone to a 45 zone. Traditionally
through the analytics, we were seeing, uh, a higher percentage of speeding violations than
we were and, and, excuse me, for the timeframe, but than we were after we turned on the
speed alerts through the safety plus. And so this period of time that you’re seeing on
this slide, uh, is, is really, I believe it’s a 60 day window. And you’d have to tell me,
Andrew, for sure, what you pulled here, but I think this is a 60 day window where we’ve
seen speeding 4.1 miles an hour plus over the speed limit during a speed limit change
reduced by 30%. So that was pre alerts to post, right? And so that shows where instant
feedback gets us that compliance and, and, and not having to go and chase the driver down
after the fact with a, a bunch of spreadsheets, right? And going through their history and
trying to get them to remember where they were three or four days ago at a certain
roadway. This is, Hey, do you remember when you got that alert in your truck truck a few
hours ago? Let’s talk about what happened there. Was the speed limit change did you come
upon on construction? Right? Is there a better way we could approach that situation by
looking ahead and making sure we’re scanning? So there, it, it really leads to a whole lot
of other, uh, discussions you can have with drivers. And I don’t, and, and, and let’s not
forget, and I think there’s a piece for this later, is how do you reward the drivers who
demonstrate improved behavior over time? Right? And so what does that look like when you
get the compliance you’re looking for? How do I, how do I sustain that compliance? And
that’s through good feedback and then sustained over time rewarding in some way, right?
And I think we have a placeholder for that as we go on. Yeah. And that, and that, that
here, right? That’s the, that’s the real life application. Um, you know, Adam excited to
bring you in on this piece of it here. Maybe you can get us started here really more, you
know, the conceptual piece of the data and, you know, from, from your perspective and when
you’re working with fleets, you know, how, how are you taking what they’re saying and
really kind of working backwards, um, to, to get back to, you know, what you’re doing
there at Geotab? Yeah, absolutely. So in the, in the world of safety and in the world of
telematics, really there’s this, a variety of factors from the vehicle diagnostics and
behavior and environment that really give us a, a picture of what’s going on. Um, and by
stitching together these multiple factors, it’s almost like, you know, you got these, each
data point is almost like a word in a book. And by putting them in the right order and
looking at the right perspective, you get the story, you get what’s going on. Um, from one
point you’re looking at the vehicle status itself. Is it safe to drive looking at
diagnostics and fault data, give you insight on that vehicle health to be like, can I
actually operate this thing today? Uh, the next step might be looking at driver behavior.
Now, the low hanging fruit typically are things like speeding, harsh braking and
cornering. Um, but I find the real meat and potatoes comes from taking a step back and
looking at the bigger picture, again, of the trends and the patterns in these behaviors,
and seeing how best can we approach coaching or, or kind of, uh, guidance into curtailing
some of the, the negative behaviors. Uh, and then lastly, kind of stepping outside the cab
and into the environment, looking at what kind of perspective can we get on the larger
situation? Uh, is there either, you know, um, speed data, we, we understand to understand
are we having, uh, speeding events or even calculated information to figure out other
dangerous areas we’re operating in? And by stitching all of these multiple factors
together, we really get context behind the events, behind the situations to get better
understanding, deeper understanding, uh, of not just what’s happening but why it’s
happening. Uh, and the why is really what’s important, because once we know why, we can
figure and shape our learning to solve how to be better and how to be safer. So taking
that all together, looking at aggregated data, uh, raw data is very important. You know,
that’s the, the, the bits and bobs, the thing, the building blocks to getting that deeper
insight. Um, and so it really helps us understand the, the general, what, what happened,
what’s the impact. But unfortunately, with what, where it’s really all present tense, it’s
all reactive, it doesn’t really tell us what’s next. But by using larger aggregated data,
bigger data sets, larger fleets, uh, and even like places like Geotab that have this huge,
massive data set, uh, we can not only get that bigger picture, but that bigger picture
also has more detail. Uh, coming back to that idea of patterns and trends, we get an idea
of what to do ahead of time. You know, instead of, uh, reacting to issues on the road, we
can design, um, strategies to figure out how do we avoid vehicle downtime altogether
instead of just responding to an event. Um, and taking that even one step further with
those big ideas of data sets. Benchmarking allows you to use and harness multiple sources
of data to really see how your fleet performs on a larger scale, on a larger stage. And
using all of these strategies together, really a, a a fine tuned way of getting
opportunities for improvement. Now, with data, it’s not all created equal, and at least
from our Geotab perspective, uh, we have an algorithm called the curve log, the curve
logging algorithm. Um, and it does two major big cool things quite actually. Um, you know,
a lot of people will typically, with the data pinging, it’s, um, at some kind of frequency
rate, maybe it’s every 30 seconds, every minute, maybe every a hundred yards or so, you
send a packet of data of what’s happening with the vehicle. At Geotab, we kind of look at
it slightly differently. We basically send the changes in data, instead, we’re constantly
polling to see, uh, how has the position changed, has the speed change engine temperature,
a variety of factors, and we’re only sending those major changes. So you can see on the
two maps here, when you use it a ping rate, you might miss kind of the granular data. You
can see how it doesn’t follow the curve of the freeway there. Exactly. And then again,
when the driver turns left into that kind of small local neighborhood there, it does miss
the actual ramp off. But by using curve logging, we can be sure that not only are we
actually mapping to the actual path and all the little bits and pieces of data, we’re also
actually sending less data overall, because we’re not sending all the pieces in between.
We’re only sending the most important stuff so we can make sure that not only we’re
getting super accurate data, we’re also spending less money to do it and cutting costs.
Uh, so all that data overhead is, is much lower, which is really nice to have. Now moving
forward into fleet benchmarking, we touched on that slightly a bit, and this idea, I think
the big benefit here is looking at not only our current issues, and not only your raw
data, but how those things relate to each other, how those relate to multiple factors in
your own system, but also into similar situations and similar fleets. Um, building a
digital twin, like a digital representation of a situation or of a vehicle, uh, lets you
compare and contrast against groups of, of data points. Um, and again, back to kind of my,
probably we say, hear me say this a lot, deeper insights, deeper understanding, more
robust, uh, perspective of like, what is really happening. You know, even this picture
here is maybe a little overwhelming. It’s a bunch of data points. But by using systems,
uh, like Drivewise or even some of the technology at Geotab, we can take all these data
points and give you context. We can give you a story, we can paint a picture to really
understand how is your fleet operating? How are your drivers behaving? How are all those
pieces coming together to tell you your safety story? So some of the cool things that you
can do with, with this benchmarking, with, with all this raw data, uh, is for example,
understanding something complex like a mixed fleet. For example, let’s say you have maybe
a few F1 fifties, you have some class eight, like 18 wheelers. Of course the vehicles
themselves are drastically different, but so are their use cases. So it’s kind of hard to
really compare apples to apples here when you’ve got one driver operating a light duty
truck and someone driving long haul over several days. So by looking at benchmarking and
looking at these group data sets, we can see, um, you know, what are the statistics for a
light duty vehicle across multiple data sets across multiple fleets? Um, how can we
leverage this larger set of information to really understand what is happening with your
fleet and how’s, how’s it stacking up? You know, is this a, is this a, a dangerous
behavior across the board and maybe there needs to be better, better changes across, or is
this something that, uh, you know, it’s, it’s hard to compare those, those two pieces. Uh,
and the nice thing is, again, with these larger data sets, with this more, this deeper
insight context, context is, is hugely important. It’s really understanding that the why
things are happening and get a better picture of how to drive that coaching, how to drive
that ahead of time guidance to make things a little safer. Now, one really cool tool I
have to nerd out a little bit, uh, is thing, a thing called active insights at Geotab. And
realistically, again, it, it’s a way to leverage the data. It’s something that we do, uh,
in-house here. And essentially what we’re doing is repairing the massive amount of raw
data that we have with some of our brilliant data scientists to really tease out some of
the more subtle and hidden patterns across some of the data. Um, in one such example, we
essentially compared sharp changes in forward and backwards acceleration with, uh, vehicle
speed all centered around certain locations. And what we found was that in certain
shipping depots, um, there were an kind of a, an unexpected level of sharp, sharp
acceleration defense, which we attributed to being high impact. And by looking carefully,
we noticed that this wasn’t driver specific or even time specific, but a location
specific. And by kind of pulling those things together, we realized that some shipping
depots perhaps were designed in such a way that made it difficult to, to avoid a dock
strike. Maybe there were high, like high inclined, uh, slopes there, uh, not enough space
to maneuver for a driver. And it made it really, uh, an effective way to coach ahead of
time and say, Hey, by the way, this is on your route. Keep in mind you do need to be
careful at this location, and this is just one, one such way of taking these really large
data sets and really dense amounts of data and pulling together a story, what from things
that previously might not have been correlated, things that you wouldn’t find a
relationship between. And so it really is the advantage of having these massive deep sense
of data that to, to get this, uh, this insight again with, uh, with raw data. We can touch
into some additional tool sets here. And Andrew, maybe you can take it away from there.
Appreciate it, Adam. And, you know, I think that’s a, that’s the good why. That’s, that’s
the, that’s the context of the technology, right? That that’s really taking a step back
and saying, okay, you know, where is this digital transformation coming from? Where is it
going? Right? So, you know, we’re gonna talk through a couple of additional tools. Again,
you know, these are all gonna be, you know, opportunities I think for fleets to say, how,
how do some of these different things fit into my fleet? You know, what are the
implications of that? ’cause we all know the more technology and the tools you have, you
know, the more people need to have eyes on it, the more you need to be actionable upon
that data. But, you know, I think some of these tools are, are, are really gonna be what
help round out everything that you’re already doing, plus your, you know, your, your
overall safety culture as a whole. So, you know, from, from the Drivewise side, you know,
way station bypass, everyone knows here what Waystation bypass is. And you know, the
beauty of some of the other products out there, not only Safety Plus, but you know, the
camera technology, some of the Geotab, um, stuff that Adam was showing is all of those
things are what are eventually going to get you more bypasses. You know, your, your bypass
is, it’s a, it’s a pretty simple algorithm based off of that ISS score, what drives down
that ISS score decreasing your CSA less violations, less crashes, right? So, you know,
having a bypass tool, you know, in conjunction with lowering those scores, being eligible
for more bypasses, that’s gonna do a couple things. You know, obviously operational
efficiency, you know, driver, it’s a great driver retention tool. If a dr, if you are a
driver and you work for a fleet who’s got an excellent ISS score and your, your bypass
rate’s in the seventies or eighties, I mean, look at the time saver you have there. You
know, I think of operations that have line haul who might have, you know, drop yards and,
and really tight turns now, especially since, you know, hours of service regs are, are
pretty cranked up. You know, what a great tool to be able to use to, you know, to make
those tight cuts. You know, those, those areas. I live in Texas and, you know, going down
35 from Dallas, you know, it’s, it’s hit or miss. You know, whether you’re gonna make it,
you know, down to San Antonio and back, you know, in a day. It all depends on traffic and
the time of day. So, you know, having these kind of, these kind of, uh, these kind of
tools are, are, are super important. Here’s a couple, I think Adam’s got on the, on the
Geotab side. Yeah. So we actually have something called a safety store card, uh, which
helps us kind of flag what we refer to as harsh events. And I spoke about a couple earlier
things like, um, high acceleration, so harsh braking, cornering, uh, or even high
speeding. Uh, we’ve kind of pull in open data for speed limits. Um, and what’s great about
this is you could really use this information, again, patterns and trends. You’re looking
at how is your fleet operating on a larger scale? Uh, and it’s not even like, actually,
Ken, you alluded to earlier, it’s not necessarily about punitive things. It’s about how
can reward drivers that are, you know, have a fantastic score and how can you use this to
better design coaching, better design advice, uh, to really drive that long-term
sustainable safety, uh, is a big factor of, of our safety scorecard. And additionally
analysis of that, of that data is always improving. So we’re really finding more of those
relationships between that data, things like I talked about with that, active insights of
seemingly unrelated information, seemingly unrelated data, has relationships, has these
intrinsics the connections that might provide cooler and deeper insights. Another such,
um, tool we have is our collision reconstruction tool. Uh, and based off raw data, you
know, we’re looking at things like accelerometer speed, GPS, uh, to rebuild collision
events. Uh, and what’s awesome, and a couple, couple factors here, we have one of course
are raw on tampered data because we’re pulling this, getting an, an accurate
representation. But because we’re using our curve logging algorithm, we’re doubly
confirmed here that we’re not missing a beat. You know, it’s not that some collision
happened in the 30 seconds between two poles of data and we’ve missed a completely, we’re
re completely rebuilding digitally what happened, uh, to get an idea from all of that
granular data. What is the perspective of, of this collision, what actually happened
leading up to, was there other environmental factors? Were there behavior factors? Was
there, you know, falls in the vehicle that could have led to this? And really get that
second by second data to understand what happened to this incident and what’s next. And
now another little nerd out here with our data connector, another cool tool we have, like
we saw before with that kind of map of, of the, of the benchmarking data and all those
points and pieces, data can absolutely be overwhelming. And it is, to me, even day to day
using it all the time, it still is. Getting a mass amount of stuff is, is a lot. Um, but
having a tool like this, which really leverages Geotab reporting expertise and visualizing
your data with power, with power BI tools like Power BI or Tableau, to get that aggregated
data in a very condensed and visual aspect. Uh, think about things like vehicle usage or
distance traveled, but in visual data that you can consume easily and, and kind of
quickly. Additionally, you can integrate all this data with your own in-house track stuff.
So for example, let’s say you’re looking at maintenance costs across the usage of a
vehicle, you can find these trends and understand what maintenance costs are coming up
based on all this aggregate data that we will deliver outwards. Awesome. Thank you Adam.
And you know, I think, you know, as we head into q and a here, you really got some good
perspective of, you know, the, the more, the abstract thought of data and how we, how we
streamline it, right? How we make sense of it. There’s so many different points. Um, Adam,
I appreciate your, your insight there of, you know, from a tech background and, and, and,
and a tech company more or less. What, what’s important, you all have been able to, to get
in and identify and, you know, talk to fleets like Riverside to say, Hey, what’s actually
important? What are we just chasing our tails on? What do you need to see versus what do
you not need to see? And then Ken, definitely your perspective of being, being able to
say, okay, this is the data that we have from x, y, and Z system, and here’s how we use
- Um, that kind of brings us into to a little bit of q and a. Ken, I wanted to start
with you. Um, you mentioned earlier, uh, you had the testimonial there from a driver
about, you know, how they like using, uh, the Drivewise system. But can you give us a
little bit of insight, you know, not only with with Drivewise, but you know, with Geotab,
with, with any other technology that you have in the vehicle, maybe some insight on, you
know, how Riverside has been able to adopt all this safety technology, and not only from
the driver perspective, but maybe, you know, dispatch and, and operations and even the
leadership team there at Riverside. Sure. Um, well, that’s a loaded question. Uh, I would
say, you know, slow and steady is the race, right? Um, sticking to the fundamentals and,
you know, being open to listen to your drivers really is where it starts. You know, we, we
initially adapted, uh, camera technology, um, about two years ago and had made a change
from one vendor to another. And, and so the, the new camera system offers inward facing
cameras. And so there’s a compromise with our drivers to say, we’re gonna, we’re gonna
shut off the inward facing portion because we believe there’s a benefit to you as a driver
and a protection to you as a driver for those times where you can be accused of, you know,
having contact with something and this is gonna help back you up, right? And so there was
a slow onboarding to adapt that. And over time, driver acceptance improved to the point
now where today we have begun considering whether or not to turn on the inward face. And
because we’ve reached the point where driver acceptance is high, right? And so when you
take on a new, um, a, a new initiative like speed, for example, you know, we, we started
with, okay, let’s talk to our top 10% worst offenders, and let’s focus really our efforts
on those folks. How can we get them to fall out of that top 10% category, right? And
that’s through constant coaching reminders, talking. Then we get the, the, the Geotab
data. We look at the trends over time, and of course, complimentary is those instant Inca
alerts from the driveway system, right? And those guys became kind of our, um, our project
to say, if we can get these folks to comply, we can really get anybody. And how do we
model that, right? What do we give them as an incentive? Do we, you know, bump their truck
a mile an hour or two if they can demonstrate a period of time where they’re in compliance
with speed, speed, uh, right? And so there’s different ways that you can do it other than
financial ways, um, where you can award them, right? Give them something for their truck,
um, like, you know, a senior radio or some kind of technology XM radio, I believe there
was a time we offered that, um, which we’re not offering at this point. But again, those
are little different knobs that you turn right on your equalizer to say what’s working,
what’s not working, and how can we sustain it through rewarding system? And one of our
safety management systems offers a rewarding tool where we can send the driver a financial
award or a gift card award or an attaboy message directly through their app on their phone
for operations. And so there’s another avenue that you have that’s outside of the, the
standard, you know, Hey, I’m semi driver a, an OBC message. This is separate because it
goes to their, their personnel app where their, you know, where their driving record is
and all that stuff. Um, and really it’s just kind of staying in front of your drivers. Um,
you know, the, the, the biggest and most important thing that I believe affects safety
long term is driver engagement, right? The, the, if, if, if you have a good relationship
with your drivers, if the door is always open, if they can come in and not feel like, you
know, they’re going to the police station to, to, to, because of a report that they’re
actually coming in and asking questions and be part of the group group, I think that’s
really the major battle. And when you can get that to happen where your free open door
policy is effective, then those other things will come along with you. Awesome. Does that
answer your question? Absolutely. No good perspective there. Uh, Adam, a quick question
for you. Um, and these don’t have to be geotab specific, but, you know, what are some of
the additional solutions, you know, that maybe you’ve, you’ve heard from fleets, um, that
they’re possibly using to really just help accelerate, you know, fleet safety? Obviously
you have a robust, you know, platform and some of your integrated partners have stuff too,
but, you know, what do you see as some of the keys maybe to, to really pushing the needle
forward on safety? Yeah. Um, well, I mean, at, at a, at a, a brief and high level, uh,
obviously actually looking at the data perspec specifically, uh, I think Ken, you
mentioned it earlier, actually looking at it and tracking your stuff. Um, I think it’s
actually our CEO Neil talks about you can’t manage what you don’t, um, what you don’t
know, you know, you need, you need to use that data. Uh, in terms of specific solutions,
uh, there’s some really cool ones. Um, off the top of my head, there’s things like the,
the lifesaver mobile that helps free fleet operators keep their drivers safe by producing
phone distractions, uh, and speeding, um, speeding events. Um, and it’s purely digital.
There’s no like add-on, uh, hardware to, to put on there. So I think it’s pretty easy
installs, which are kind of cool about that. Um, additionally, there’s also the extract
solutions, uh, which allow digital auto insurance claims. Uh, so it kinda speeds up that
process. It, it’s all automatic, it’s all kind of in the background. So it, uh, it helps
kinda get those claims through without a lot of the legwork and the paperwork and kind of
the headache, quite frankly, uh, that sometimes those can take. Um, and even outside of
that, kind of coming back to more of coaching and, and predictive things like that, uh,
there is called, what is it called? It’s Predictive coach actually, uh, named, uh, you
know, pretty on the nose there. Uh, and they do, uh, automatic, uh, driver behavior
detection and essentially based on the behaviors detected, it’ll also assign, uh, coaching
or other strategies to kind of curtail that behavior, uh, and kind of directly apply to
what’s, uh, what’s being happened, uh, in the field. Great. And Ken, I I’m seeing one more
question here. Um, and this is definitely a, a, a good, you know, fleet perspective
question. It’s, you know, you’ve explained some of what Riverside is doing, but you know,
outside of technology, what’s a thing or two that, that you’ve kind of implemented since
you started at Riverside or that you’ve worked in con conjunction with the leadership team
to really help change that culture from the, from the reactive to proactive? You might be
on mute, Ken, Of course, I’m on mute one time. I did. I think there’s, there’s the open
door of things to do with your drivers. It, it, it’s really, really wide and, uh, you
know, I’ll give you an example of today. Um, so we, we today have set up outside my
office, um, carnival Day, right? So all drivers that come to the yard are encouraged to
come see safety, and there’s a bucket there with a bunch of questions in it. They get
three questions. If they answer one correctly, they get another one of them each time
they’re given a ball and they get a chance to throw the ball to, into the, the pile of
buckets and inside of those buckets is a prize, right? So that’s a little thing, but what
that is, it’s a compliment to our engagement with drivers. We want them to not fear
safety. We want them to come in and answer some questions or ask some questions, right?
The, I think that safety in general tends to have, um, kind of a shadow of fear from
drivers across the industry. And the more we can knock down that fear and the more that we
can show them that we’re here to be a resource and an asset, um, and someone that they can
rely on for help, I think the more they tend to take those questions a little deeper and a
little deeper, and each conversation gets really down to the meat and potatoes of how do I
understand this regulation? How do I understand, you know, as a lease purchased driver
that I’m fueling in the right place? Things that they would tend to not wanna ask or go to
another driver for, they now come in here, right? And so I use myself as an example.
Everyone wants to come to work with the attention of doing a great job, right? Drivers in
general don’t wanna come to work to do the wrong thing or a very, very, um, and so they’re
just afraid to ask sometimes because one, they think their question’s not relevant or it’s
not important, or they’re afraid of what they might hear. And I think that we’ve done a
really good job here, um, to, to, to close it out of engage in operations where it’s,
it’s, you know, it’s not a, it’s not a struggle between operations and safety where we
have come together and we’ve tried to influence our drivers as a collective, not as two
separate departments, right? And I find success in that, in our overall safety efforts
because let’s, let’s face it, safety department has, you know, 20 whatever people. And if
there’s a thousand drivers in that fleet, we can’t touch them all. They probably, you
know, there’s a portion of them that’s probably not gonna trust getting a phone call from,
but their frontline manager who’s responsible for their freight and their home time and
their pay, there’s a, there’s a mutual trust there, mutual. And so if we could train our
managers to be better stewards of our safety programs and our efforts, that will translate
down to the drivers, uh, just naturally. And, and I know I went on there for a few
minutes, but I hope that answers your question. No, that, that’s great. Ken. And I
definitely appreciate the perspective your, you know, your boots on the ground, uh, there
at Riverside. Um, there is no more questions in the chat box. Um, I encourage you though,
you know, if, if you have comments, questions, if you’re curious about anything you’ve
seen here, uh, you see the screen, um, talking about Geotab specific, um, uh, uh, pretrial
for safety plus, you know, that, you know, TCA is a family and we, and we’re, we’re happy
to, you know, offer trials to, to anybody. You don’t have to be on a Geotab device. Um, if
you’re not with Geotab, you know, please reach out to, to Drivewise to, to your TCA reps
and we’ll get you in touch with the right people. Um, and Ken, I’m gonna volunteer you bug
Ken, you know, get, get that, get that real world perspective of, of some of the
technology that he’s using that you’ve seen here today. And, and you know, how it’s, how
it’s taken a positive effect on their, on their culture there at Riverside. Um, so with
that, I will turn it back to Shayna. Um, I appreciate everybody’s time today, Right? Thank
you so much. Thank you to all of our panelists today for such a great conversation, very
impactful session. And for our attendees, thank you for joining us. And once again, we
would like to encourage you to enroll in any of TCA’s certificate programs to earn credit
for your attendance and participation in today’s event. We have also provided contact
information for each of the speakers so that you can reach out to them following today’s
webinar to continue the conversation. And when the webinar closes, you’ll be redirected to
an online survey and we ask that you take a moment to fill it out. So this concludes our
webinar, and I would like to wish everyone a wonderful afternoon, and thank you so much
again.
Read Transcript
Ready to utilize cutting-edge technologies to establish a rewarding safety culture in your organization?
In this webinar, discover practical strategies and innovative programs that help to develop an environment that drives lasting change and improves safety outcomes. We explore the groundwork set by Riverside Technology and other innovative tools to enhance the current program you are utilizing.
Speakers:
Andrew Diesel, Director of Sales for Safety Solutions, Drivewyze Inc
Adam Roque, Solutions Engineering, Development Consultancy Team Lead, Geotab
Ken Resta, Director of Safety, Riverside Transportation Inc