
Most fleets know their “safety scores.” They may not check them every week, but they know roughly where they stand. They know whether they are above or below intervention thresholds. They know whether a broker has ever asked about it. They certainly know whether their insurance carrier or broker has referenced it during renewal conversations.
What fewer fleets truly understand are the details behind those scores and what they should be telling them.
For many carriers, CSA scores – or more formally, CSA Safety Measurement System (SMS) scores – have simply become grades or rankings. They pay closer attention when they get too high and tend to ignore them the rest of the time. This mindset is the result of an industry that talks about CSA in terms of thresholds and comparisons.
But treating the CSA SMS merely as a report card is one of the most expensive errors a fleet can make.
Misreading CSA SMS scores can have dramatic effects on insurance premiums and renewals. It can influence audit frequency and depth, shape how plaintiff attorneys frame negligence arguments, and impact shipper vetting, RFP competitiveness, and long-term reputation.
The Hidden Cost of “We’re Fine”
A 325-truck regional dry van carrier operating across the Midwest had no reason to panic. Their CSA SMS scores (i.e. BASIC percentiles) were below FMCSA intervention thresholds. They reviewed their scores quarterly and saw nothing alarming.
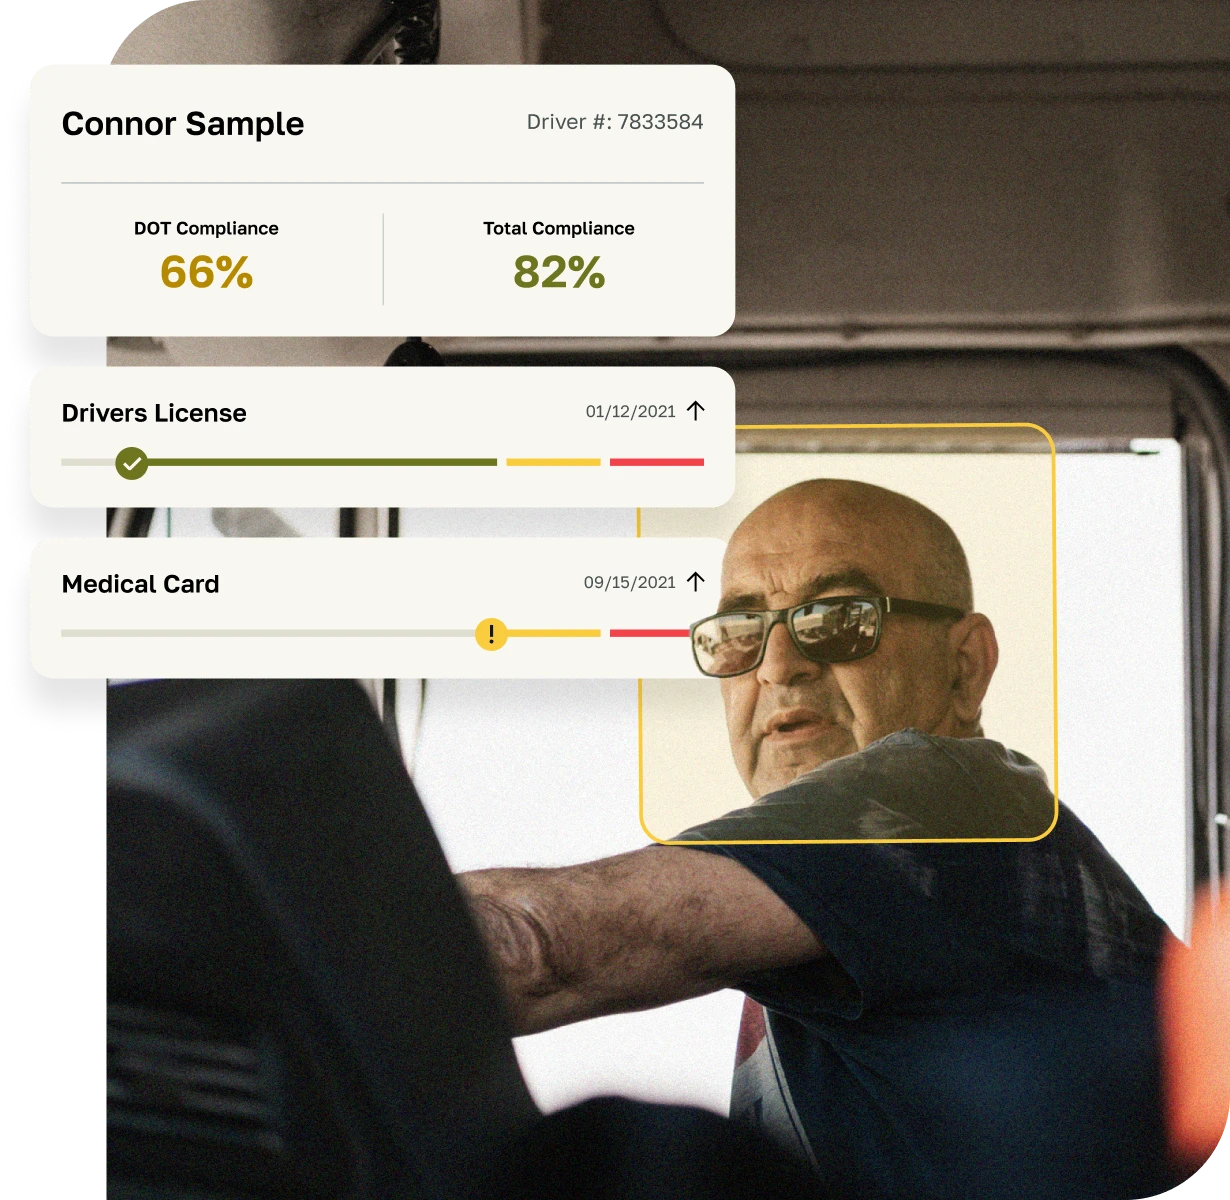
Over two quarters, however, their Driver Fitness score began trending upward. The cause? A handful of expired medical certificates. A documentation lapse. Minor qualification oversights. Nothing dramatic.
Because the fleet remained below threshold, the trend did not trigger action.
Six months later, two preventable violations prompted deeper scrutiny. During renewal, the insurance carrier noted the pattern. The fleet was reclassified into a higher risk tier. Premiums increased mid-term.
The percentile didn’t cause the problem. Missing the signals did.
CSA 101: Why It Was Built
CSA was implemented to put a greater focus on current, on-road measures of safety performance. Previously, FMCSA’s primary enforcement and safety assessment tool was the on-site compliance review which focuses primarily on recording keeping, not on-road performance.
The goal of CSA was to identify patterns of unsafe behavior and prioritize carriers for intervention. The system aggregates roadside inspection data, crash history, and violations into Behavioral Analysis Safety Improvement Categories (BASICs). These factors are time and severity weighted. More severe and more recent events carry more weight. Then, carriers are compared to similarly sized fleets, and percentile ranks are assigned.
Those percentiles are not grades, per se. They are comparative indicators.
CSA was never designed to offer full operational context or determine intent. It surfaces patterns that may suggest elevated crash risk to help prioritize enforcement interventions. Three realities matter more than most fleets realize.
- Trends matter more than snapshots. A rising trajectory is often more meaningful than a single percentile rank (i.e., a score).
- Exposure shapes perception. Fleet size, where they operate, inspection frequency, and operating model influence how data accumulates.
- CSA is dynamic. Patterns persist in the record long after a single violation feels resolved internally.
If CSA is not a report card, then what is it really telling you?
What CSA Is Actually Diagnosing
CSA reveals your fleet’s operational health. When violations cluster, trend upward, or repeat within specific segments of an organization, they usually point toward breakdowns beneath the surface. Not necessarily reckless drivers. Not necessarily bad equipment. But weaknesses in processes, systems, and controls.
A rise in Driver Fitness violations often reflect lapses in expiration tracking or onboarding controls. Repeated maintenance findings may signal preventive maintenance drift or inconsistent review of drivers’ daily vehicle inspections. Unsafe Driving or Hours of Service (HOS) trends may indicate coaching gaps or operational pressure misaligned with compliance expectations.
CSA does not explain why directly, but it points to where you should look.
Repetition Reveals Root Cause
A 275-truck refrigerated carrier hauling temperature-sensitive grocery freight across the Southeast began seeing repeated HOS violations at one of its three terminals.
The violations were not extreme. No dramatic spikes. But the HOS score trended steadily upward over two quarters.
Leadership initially labeled the issue “driver non–compliance.” The terminal had recently hired several newer drivers. The response focused on reinforcing policy and increasing warnings.
The violations persisted.
When the fleet conducted a deeper review — mapping violations findings against dispatch schedules and delivery windows — a different pattern emerged. This terminal had recently secured several new grocery contracts with narrow unloading windows. Dispatchers were building schedules with little buffer for detention or traffic delays.
At the same time, internal log review processes were inconsistent. Early warning signs were not being flagged before roadside inspections occurred. Drivers were not intentionally violating regulations. They were operating within a system that subtly incented stretching them.
CSA did not diagnose the dispatch issue or identify the scheduling strain. It did not flag weak log auditing. It flagged a cluster of the symptoms.
Once dispatch planning was standardized and log review strengthened, violations declined. More importantly, the fleet corrected an operational design flaw that had quietly increased legal and insurance exposure.
The Risk Multiplier: When Signals Are Ignored
CSA is cumulative. When minor patterns are left unexamined, they become documented histories. Documented histories influence underwriting decisions. In litigation, they can be framed as evidence of systemic neglect.
The most expensive CSA problems are rarely dramatic spikes. They are slow drifts.
From Minor Trend to Major Exposure
A 40-truck flatbed carrier serving regional construction projects experienced a gradual uptick in Vehicle Maintenance violations. Brake adjustments. Lighting defects. Minor inspection findings.
They remained below threshold. No warning letters arrived.
Over two years, however, the documented maintenance pattern accumulated. After a serious crash involving one of their tractors, plaintiff attorneys reviewed CSA history and highlighted the repeated maintenance findings as evidence of systemic failure.
The violations themselves were modest, but the pattern painted a narrative that led to legal exposure.
From Score Management to Risk Engineering
There is a fundamental difference between managing CSA scores and engineering risk controls.
Reactive fleets watch percentiles. They respond when thresholds approach. They correct isolated violations and hope the numbers stabilize.
Top performing fleets study trends. They prioritize severity and connect CSA data to dispatch systems, maintenance workflows, onboarding controls, and coaching programs. They document corrective action and measure whether patterns get resolved.
They understand that CSA should inform business discipline, not trigger panic.
The goal is not to achieve a lower number. The goal is to reduce risk.
Why Interpretation Matters
CSA reports do not connect operational silos or explain why violations cluster. They do not prioritize which trends carry the greatest legal or insurance exposure.
Reading CSA diagnostically requires regulatory fluency and operational experience. It requires understanding how enforcement interprets patterns and how litigators frame them. It requires distinguishing between statistical noise and systemic weakness.
Without interpretation, fleets often chase symptoms. They overcorrect in visible categories while missing deeper risk drivers. With proper interpretation, CSA becomes an early-warning radar system.
What High-Performing Fleets Do Differently
The fleets that consistently outperform do not obsess over thresholds. They understand that CSA is something to leverage, rather than survive. They review CSA trends monthly. They focus on repetition and severity, not just percentiles. They integrate compliance data across departments. They document corrective actions. They treat compliance as a continuous management discipline.
Beyond the Score
CSA’s influence is expanding. Insurance carriers rely on trend analysis. Shippers incorporate safety data into procurement decisions. Plaintiff attorneys routinely examine CSA histories. Regulatory scrutiny is not decreasing.
In this environment, where percentiles matter less than interpretation, CSA signals will become even more valuable for the operational gaps they reveal and the efficiency and savings that can be achieved by addressing them.
Are you reviewing trends monthly, or only when something spikes? Do you understand which BASIC categories create the greatest legal exposure for your operation? Could you defend your corrective action strategy in an audit or courtroom tomorrow?
If not, it may be time to stop reading the CSA Safety Measurement System as a set of scores and start treating it like the diagnostic system it is designed to be.
Open a strategic review of your CSA trends before the next renewal, audit, or major catastrophic claim forces you to do so.